Have you checked your fitness or wellness website’s health with Google Analytics? Did you even know there were website analytics tools?
Tape measure? Check. Scale? Check. Heart rate monitor? Check. You probably couldn’t run your wellness business without these essential tools.
Yet your business probably spends thousands on its website with absolutely no website analytics tools that measure its effectiveness.
We’ll show you how to improve your understanding of what’s working and what’s not on your website.
What are vital statistics for our website?
Websites have a unique advantage over traditional sales and marketing materials. While it’s hard to know many people really read a newspaper ad, the company that hosts your website maintains electronic files with vast amounts of raw data about visitors to your site.
Now, that raw data isn’t terribly helpful by itself. So “Web analytics tools”, also called “site statistics software”, analyze that raw data and transform it into meaningful information – vital statistics that you can take action on.
Unfortunately, many site owners don’t know that this information exists. And those who do often find it hard to interpret.
The good news is that Google offers free, easy-to-implement web analytics that are genuinely helpful for business managers. It’s a tool that many business owners don’t know about – and it won’t cost you a dime.
How can we get Google Analytics?
1) Sign up for a Google account if you don’t already have one.
2) You’ll be asked to place either a few lines of code in your home page file or a tiny file on your website to verify that you’re the legitimate owner of your site. It’s extremely easy to do this yourself or have your web developer do it.
2) Next, you’ll copy a few lines of tracking code provided by Google to each page on your site. This code tracks the behavior of visitors on your site.
3) You’re done! Within about twenty-four hours, Google will start reporting useful information about your site.
The information in Google Analytics can be overwhelming, so start with these key indicators:
The Google Analytics Dashboard
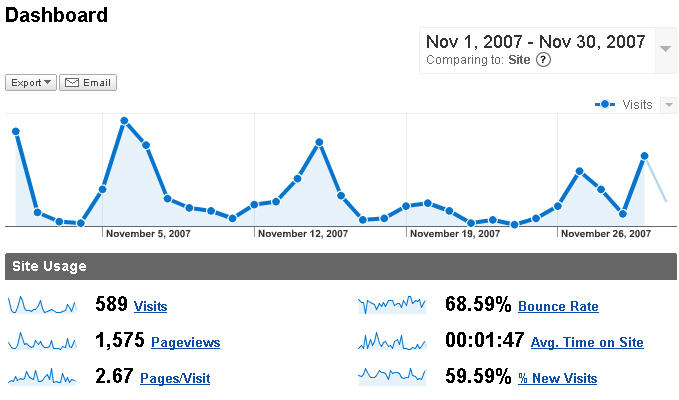
When you log into your Google account and click View Reports next to your site’s web address, you’ll see is the Google Analytics Dashboard:
Click to see larger image
At the top you’ll see a graph of the trend in visits to your site. You’ll also see several key indicators below the graph. Begin by focusing on visits and bounce rate:
1) Visits – total number of people who visited your site. As you tweak your site to make it more effective, this number tells you whether your changes had the desired effect or not.
2) Bounce Rate – % of visitors who left your site as soon as they arrived. Ideally, your bounce rate should be no more than 30% to 40%. A significantly higher bounce rate tells you that 1) people are expecting one kind of business and finding another when they get to your site or 2) that your business is what they expected, but they’re disappointed by your site’s content.
The Traffic Sources Reports
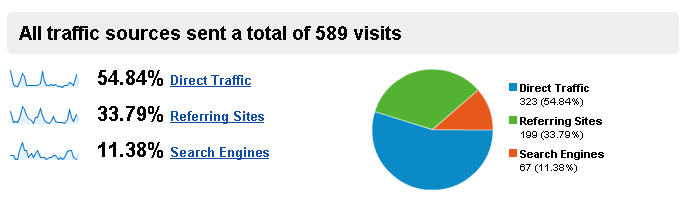
Next, click Traffic Sources on the left. This report gives you a detailed picture of how visitors found your website.
Click to see larger image
1) “Direct traffic” means they typed your site’s web address directly into their browsers. For example, they may have seen it on poster or doorknob hanger.
2) “Referring Sites” counts visitors who clicked on a link to your site that was provided by another site. For example, they may have clicked on a link on your local Chamber of Commerce’s website.
3) “Search Engines” counts visitors who found your site via MSN, Yahoo, Google or another search engine. Perhaps someone found your site by typing “wellness center north dallas” in Yahoo.
Knowing how people find your website helps you decide how to improve your site and your overall business marketing.
For example, if most people find you through search engines, you may want to optimize your site so that it shows up higher in search results. If you just ran a postcard campaign – but your “Direct Traffic” count is low – your campaign may not have inspired many website visits.
The Content Reports
1) Next, click Content on the left side of your Dashboard. When the menu expands, choose “Top Content”. You’ll see a list of the most-visited pages. Typically your home page will be first.
When you look at “Top Content”, ask yourself this question: “If a site visitor is only going to look at a few pages, are these the top 5 or so pages I’d want them to see?”
If visitors are looking at relatively unimportant pages, consider deleting them or giving them less prominence. And assess whether your core content is well-written, clearly presented and compelling.
2) Then, choose “Top Exit Pages” on the Content menu. You’ll see a list of the last page visitors looked at before they left your site. For example, if visitors leave on your programs and services page, your descriptions may be vague or confusing. If they exit on your home page, that’s a major red flag and your bounce rate, discussed above, is probably high.
3) Finally, choose “Site Overlay” on the Content menu. This feature temporarily superimposes tiny graphic indicators that only you can see on top of your website. The indicators visually indicate how many visitors clicked each link on a page so that you can literally see what caught their eye. If they’re not clicking on the most important links, rearrange your content.
But Wait…There’s More…
We’ve only scratched the surface of this useful tool. For example: if you use Google’s AdWords pay-per-click advertising and sell products like nutritional supplements or exercise gear, you can set up click-through goals linked to your AdWords advertising and track which AdWords actually turn into sales.
You can also look at the “path” that visitors take through your site – which page they start on, which pages they go to next, and which page they exited on.
Once you’ve familiarized yourself with the basic reports, take some time to explore the capabilities of this powerful tool. You’ll find invaluable insights that help you dramatically improve the business results from your website.